· Patrik · Engineering · 5 min read
Building an Outdoor Map Style from Scratch
Designing a map style for hikers and cyclists means making thousands of small decisions — which trails to show, how to render contours, when hillshading helps vs. when it clutters. Here's how we approached it.

A map style isn’t just colors and fonts. It’s a set of opinions about what matters.
When you’re building a style for outdoor navigation — hiking, trail running, cycling — those opinions become very specific. A road map doesn’t need contour lines. A transit map doesn’t need hillshading. But an outdoor map needs both, plus trails, springs, shelters, peaks, and a dozen other things that urban maps ignore entirely.
The MapRiot outdoor style took months of iteration to get right, and it’s still evolving. Here’s what we learned building it.
The layer stack
A MapLibre GL style is built from layers, rendered bottom to top. Our outdoor style has over 40 layers organized in this order:
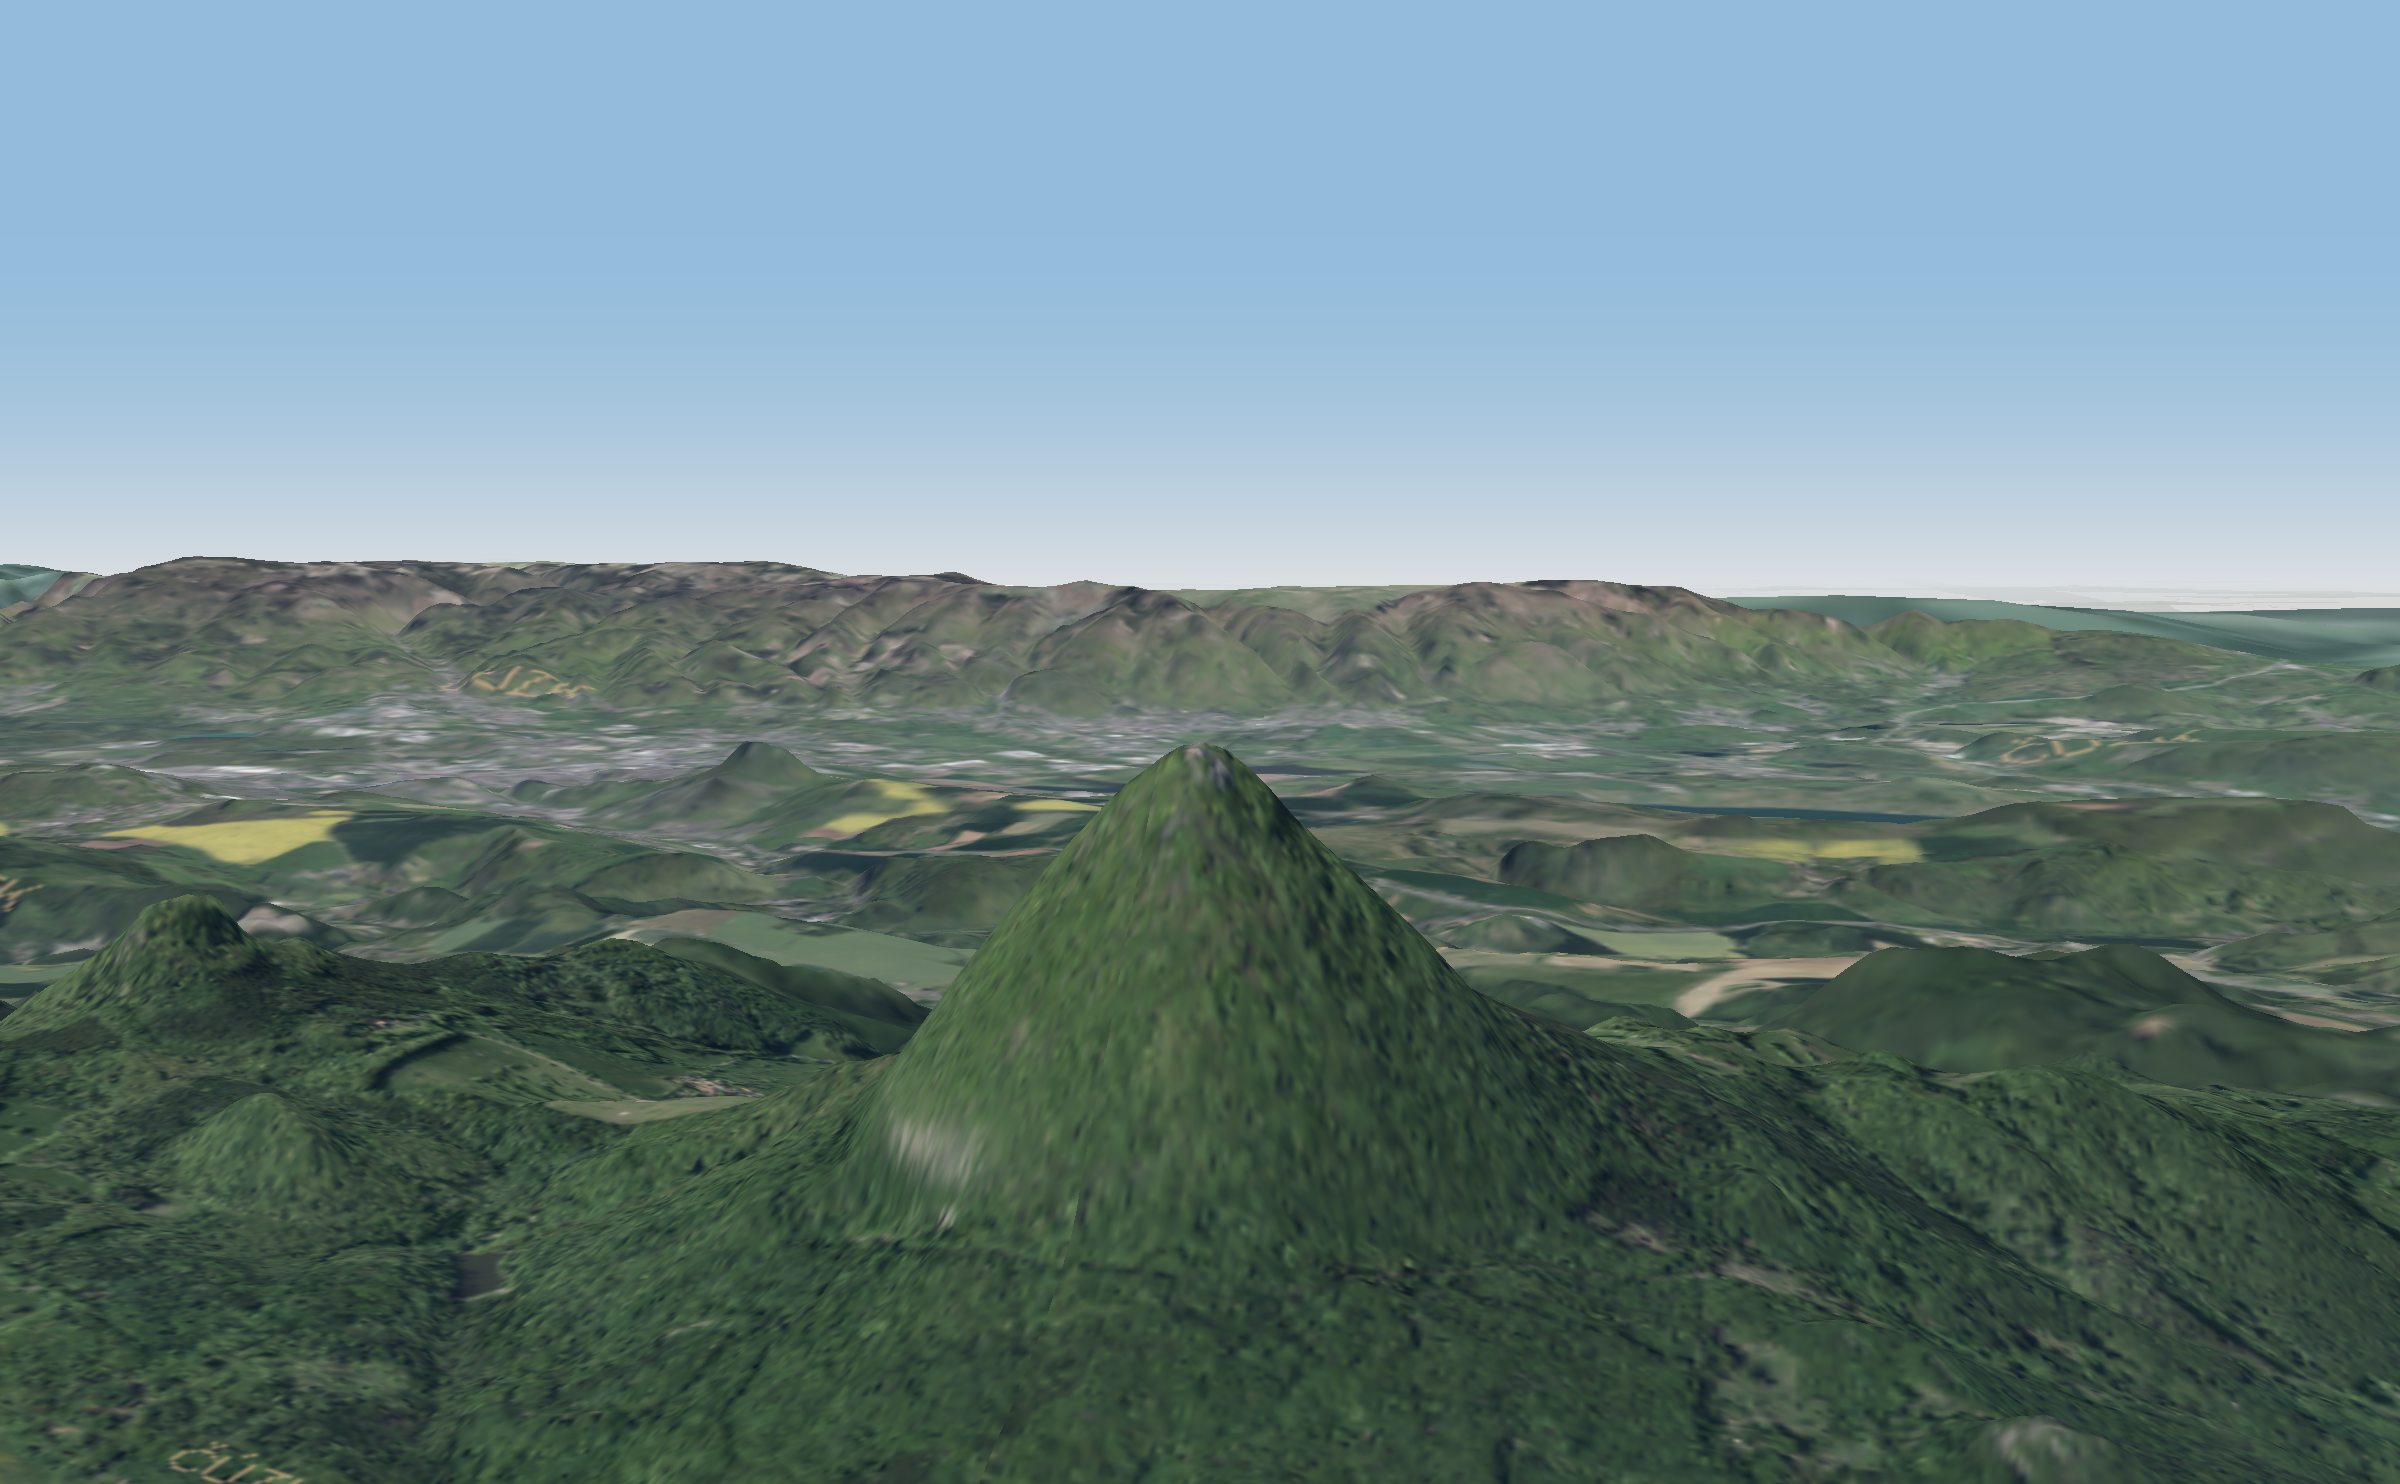
Background and landcover — the base canvas. Forest, grassland, glacier, sand, bare rock. These set the tone and give you a sense of the terrain before you’ve even looked at contour lines.
Relief shading — a raster layer rendered at low zoom levels (roughly z0–z4) that gives broad terrain shape. Think of it as the “satellite view feel” without satellite imagery.
Water — rivers, streams, lakes, coastline. We distinguish between permanent and intermittent waterways because in many hiking regions, knowing whether that stream will actually have water matters.
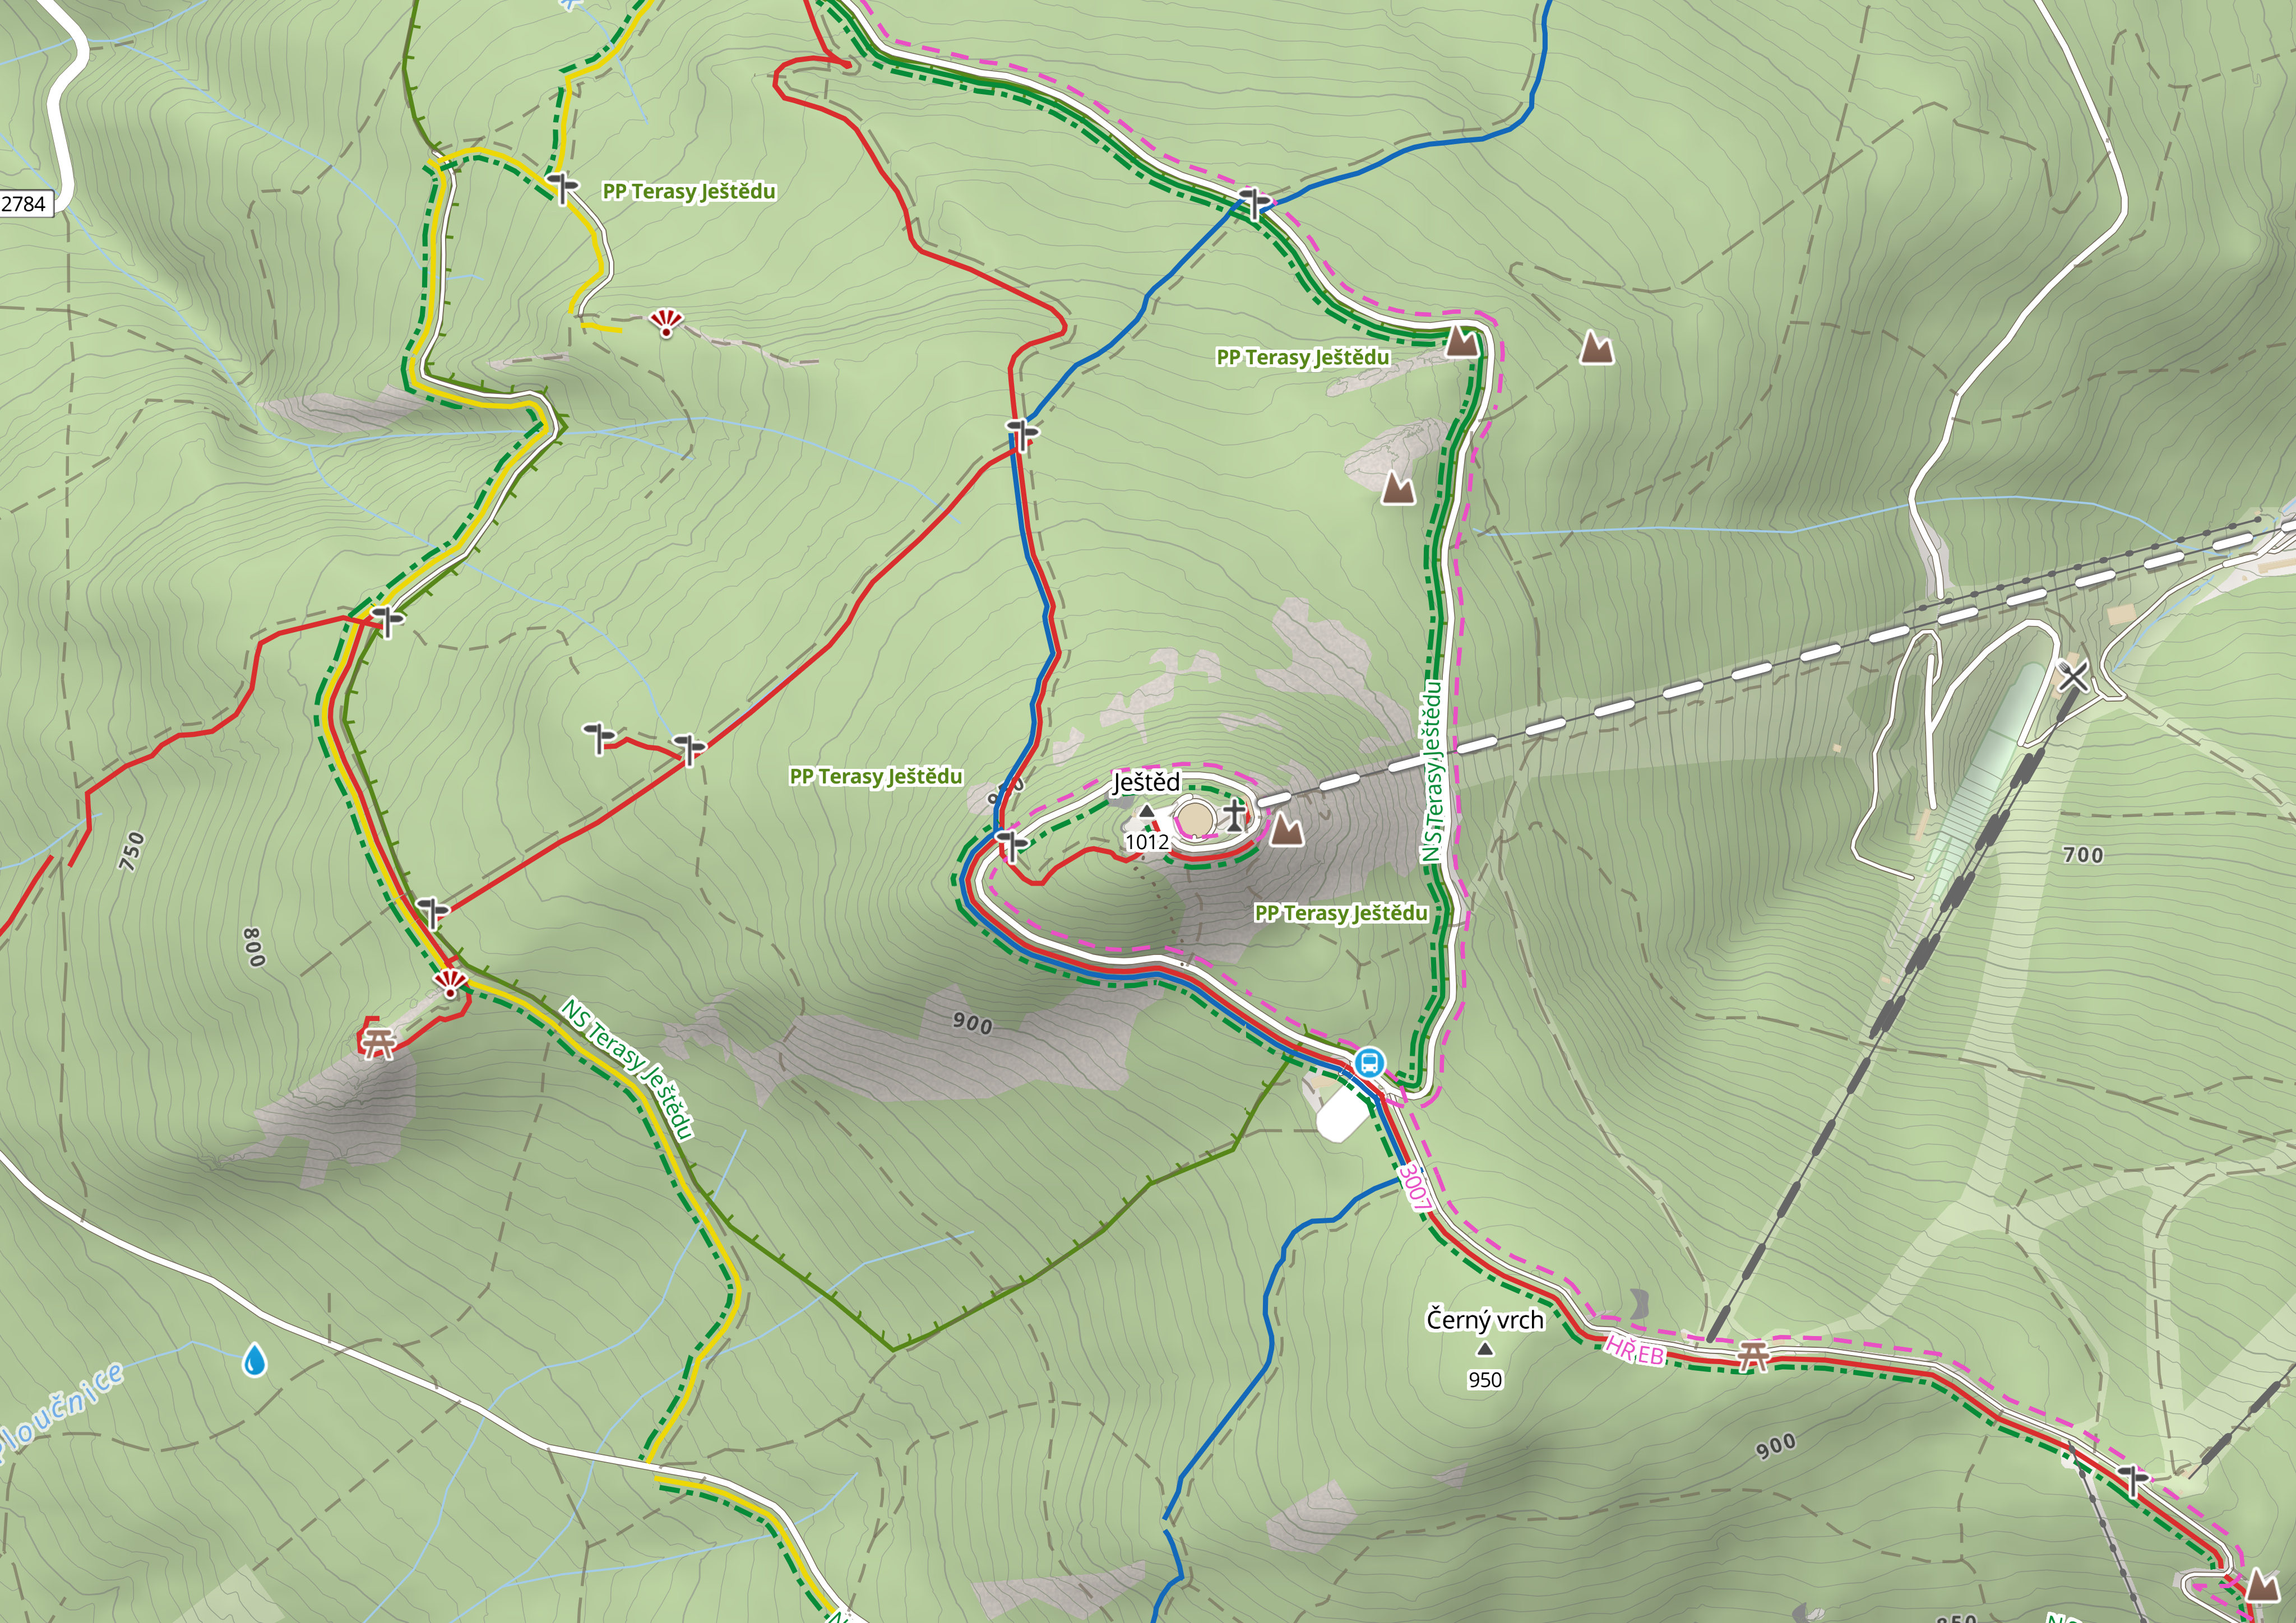
Contour lines — elevation isolines at 10m or 50m intervals depending on zoom. This is where a lot of the character comes from.
Roads and paths — the transport network, with careful distinction between paved roads, gravel tracks, footpaths, and dedicated cycling routes.
Hiking and cycling trails — color-coded by their official marking (red, blue, green, yellow). These are stacked so they remain visible even when multiple trails share the same path.
POIs and labels — peaks, springs, shelters, restaurants, viewpoints, public transport stops, city and place names.
Hillshading — a DEM-based layer using
raster-demsource type that adds depth perception through slope shading.
The contour problem
Contour lines are arguably the most important feature of an outdoor map. They tell you at a glance whether you’re heading into a gentle valley or a cliff face.
But generating good contours is surprisingly hard. The quality depends entirely on the source elevation data, and elevation data varies wildly by region:
Europe — We use Sonny’s EU DTM data, a unified collection of national lidar and satellite elevation models across European countries, available under CC BY 4.0. Different countries fall in different UTM zones, so we reproject each country separately.
Rest of world — We use JAXA ALOS AW3D30, a global satellite DEM from the Japanese Aerospace Exploration Agency. 30m resolution.
Each country gets its own contour data source. For Czechia, we use national survey data (ČÚZK), which provides much better resolution than satellite-derived DEMs. For Austria, a different source again. The raw DEMs are reprojected, harmonized, and processed into vector tile contours per country.
The result is contour lines that feel native to each country’s terrain rather than a one-size-fits-all global product.
Color-coded trails
If you’ve hiked in Central Europe, you know the trail marking system. Routes are painted on trees and rocks in specific colors — red, blue, green, yellow — each maintained by local hiking clubs.
OpenStreetMap captures this information in the osmc:symbol tag on route relations. We parse these tags and render trails with their correct color, drawing them as stacked lines so you can see when multiple routes share a path segment.
This sounds straightforward. It isn’t. Trail data in OSM is messy. Routes sometimes lack color tags. Some regions use different systems entirely. And the rendering has to handle edge cases like:
- Three trails sharing a single forest path
- A trail that switches color at a junction
- Cycling routes that overlap with hiking routes (we separate these into distinct visual layers)
We spent weeks getting the stacking and label placement right. It’s one of those details that most users will never consciously notice — but they’d immediately notice if it were wrong.
Hillshading: the art of depth
Flat contour lines on a white background are informative but lifeless. Add hillshading and the map suddenly has depth — you can feel the terrain.
We generate hillshading from the same DEM data used for contours. The pipeline encodes elevation as RGB values (a technique called terrain-RGB encoding), creates tiled raster data, and serves it as a raster-dem source in MapLibre GL.
The client then computes illumination on the fly, simulating a light source from the northwest (the cartographic convention). The result is shadows on south-facing slopes and highlights on north-facing ones.
Getting the opacity right is critical. Too strong and the shading overwhelms trail markings and labels. Too subtle and you lose the depth effect. We settled on a balance that enhances terrain perception without competing with the information layers above it.
What we’d do differently
Looking back, a few lessons:
Start with fewer layers. Our early prototypes tried to show everything at every zoom level. The result was visual noise. The current style is the product of aggressive simplification — showing less at each zoom level so the important things stand out.
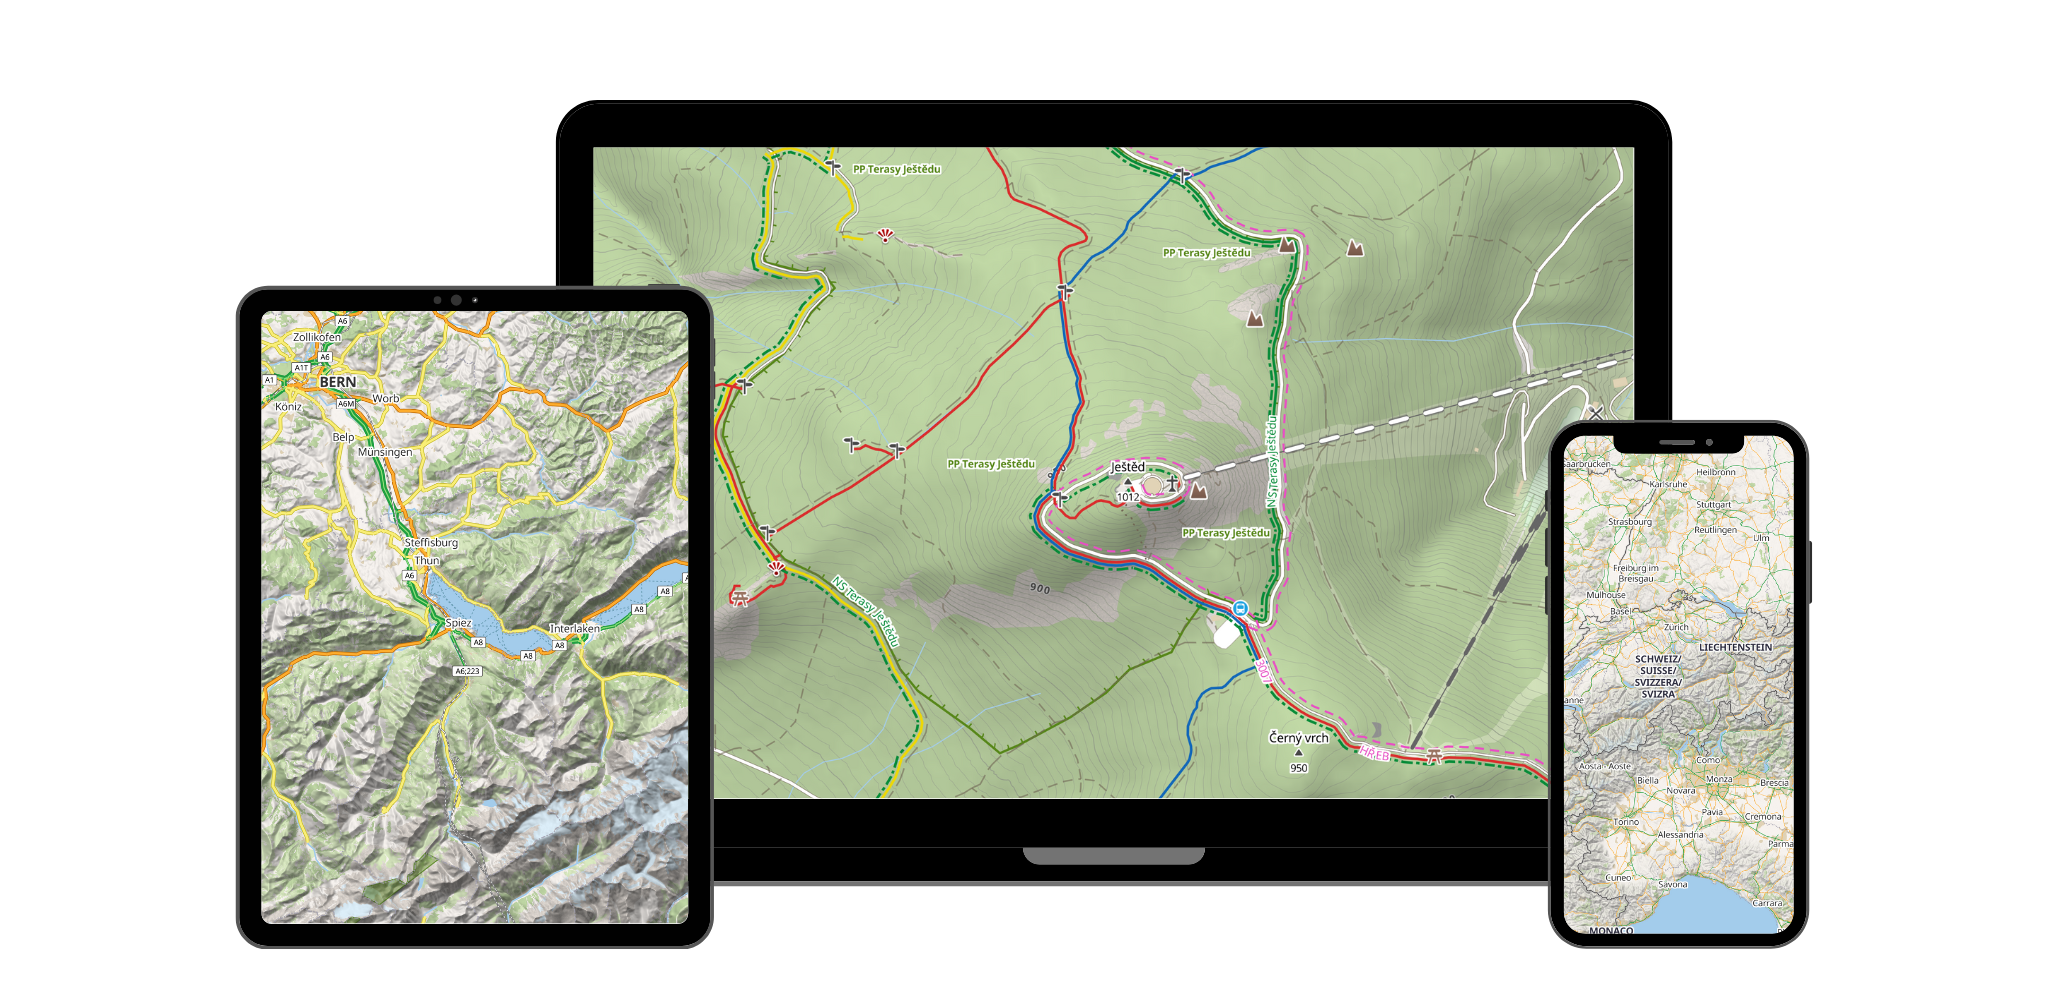
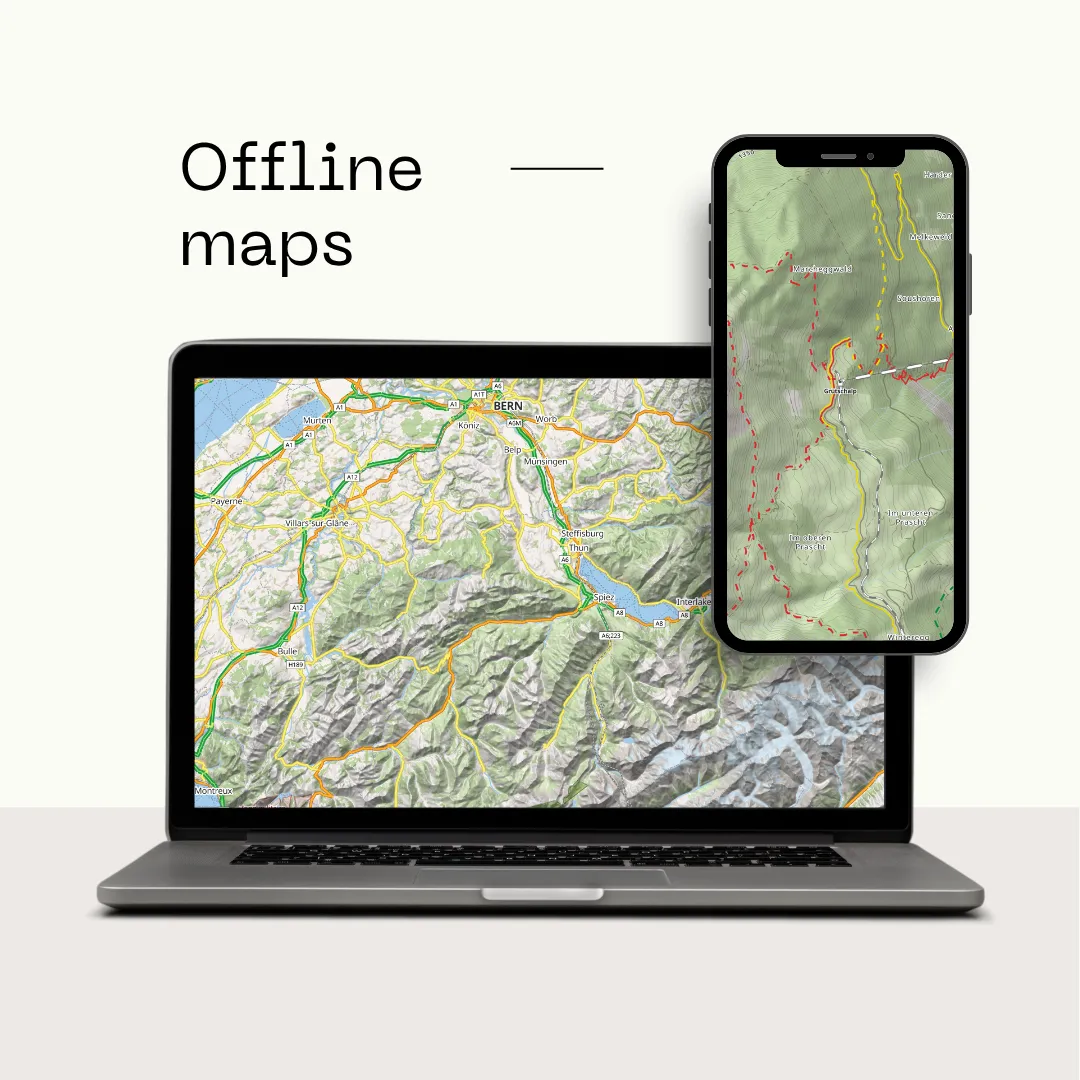
Test on phones first. A style that looks great on a 27-inch monitor can be unreadable on a 5-inch phone screen in direct sunlight. We now test every change on mobile before merging.
Contour sources matter more than rendering. We spent a lot of time tweaking contour line thickness and color before realizing the real issue was source data quality. Once we switched to per-country DEM sources, the contours improved dramatically even with the same style.
Try it yourself
The outdoor style is available to any MapRiot user. Sign up for a free account, grab your API key, and point your MapLibre GL JS app at our style URL. Or just browse the map to see it in action.
If you’re building an outdoor app and have opinions about what the style should show (or hide), we’d love to hear from you. The style is still evolving, and real feedback from developers in the field is worth more than any amount of armchair cartography.